
Statistics
Council
Governing party: PPdeG
Area: 72.90 km²
Population: 4,291
Average age: 45.6 years
Note: All statistical data come from the Tax Agency.
Employment
Employment statistics, December 2016
Social Security registrations. December 2016 data.
| December 2016 | Total registered workers | Change | |||
| Monthly | Annual | ||||
Absolute | Relative | Absolute | Relative | ||
Total | 1265 | +1 | 0.08 % | +29 | 2.35 % |
SCHEME: | |||||
GENERAL | 718 | +2 | 0.28 % | +37 | 5.43 % |
SELF-EMPLOYED | 484 | -1 | -0.21 % | -10 | -2.02 % |
AGRICULTURAL | 25 | 0 | 0 % | +2 | 8.70 % |
DOMESTIC | 29 | 0 | 0 % | -4 | -12.12 % |
SEA | 9 | 0 | 0 % | +4 | 80.00 % |
COAL | 0 | 0 | 0 % | 0 | 0 % |
Unemployment. December 2016 data.
| December 2016 | Total unemployed | Change | |||
| Monthly | Annual | ||||
Absolute | Relative | Absolute | Relative | ||
Total | 216 | +12 | 5.88 % | -29 | -11.84 % |
MEN | 102 | +13 | 14.61 % | -17 | -14.29 % |
WOMEN | 114 | -1 | -0.87 % | -12 | -9.52 % |
UNDER 25: | 7 | -2 | -22.22 % | -3 | -30.00 % |
MEN | 4 | 0 | 0 % | -4 | -50.00 % |
WOMEN | 3 | -2 | -40.00 % | +1 | 50.00 % |
AGED 25 TO 44 | 109 | +9 | 9.00 % | -17 | -13.49 % |
MEN | 48 | +6 | 14.29 % | -7 | -12.73 % |
WOMEN | 61 | +3 | 5.17 % | -10 | -14.08 % |
AGED 45 AND OVER | 100 | +5 | 5.26 % | -9 | -8.26 % |
MEN | 50 | +7 | 16.28 % | -6 | -10.71 % |
WOMEN | 50 | -2 | -3.85 % | -3 | -5.66 % |
SECTOR: | |||||
AGRICULTURE | 6 | +1 | 20.00 % | -3 | -33.33 % |
INDUSTRY | 30 | -1 | -3.23 % | -1 | -3.23 % |
CONSTRUCTION | 20 | -1 | -4.76 % | -12 | -37.50 % |
SERVICES | 148 | +11 | 8.03 % | -7 | -4.52 % |
NO PREVIOUS EMPLOYMENT | 12 | +2 | 20.00 % | -6 | -33.33 % |
Population
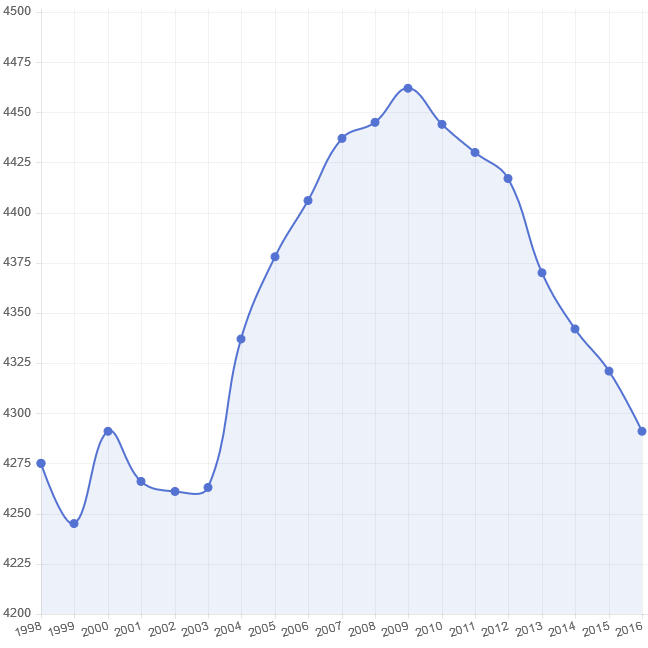
Boqueixón – Population trend from 1998 to 2016
Boqueixón – Residents by country, excluding Spain
| Residents by country of birth | |||
| Country | 2016 | Change (2015) | |
| France | 28 | 1 | |
| Italy | 6 | 0 | |
| Poland | 1 | 0 | |
| Portugal | 12 | -1 | |
| United Kingdom | 12 | 0 | |
| Germany | 7 | -2 | |
| Romania | 2 | -1 | |
| Ukraine | 2 | 1 | |
| Morocco | 6 | 0 | |
| Nigeria | 1 | 0 | |
| Cuba | 7 | 2 | |
| Argentina | 15 | 2 | |
| Brazil | 8 | 0 | |
| Colombia | 3 | 0 | |
| Ecuador | 1 | 0 | |
| Paraguay | 1 | 0 | |
| Peru | 1 | 1 | |
| Uruguay | 5 | 0 | |
| Venezuela | 16 | 1 | |
| China | 3 | -1 | |
| Other | 30 | 2 | |
Boqueixón – Population by sex and age
| Year 2016 | |||
| Age | Men | Women | Total |
| 0-5 | 78 | 81 | 159 |
| 5-10 | 81 | 97 | 178 |
| 10-15 | 79 | 69 | 148 |
| 15-20 | 78 | 68 | 146 |
| 20-25 | 123 | 92 | 215 |
| 25-30 | 121 | 115 | 236 |
| 30-35 | 150 | 147 | 297 |
| 35-40 | 143 | 158 | 301 |
| 40-45 | 185 | 156 | 341 |
| 45-50 | 144 | 175 | 319 |
| 50-55 | 186 | 143 | 329 |
| 55-60 | 152 | 151 | 303 |
| 60-65 | 140 | 146 | 286 |
| 65-70 | 113 | 131 | 244 |
| 70-75 | 118 | 106 | 224 |
| 75-80 | 74 | 109 | 183 |
| 80-85 | 90 | 119 | 209 |
| 85- | 58 | 115 | 173 |
| Total | 2.113 | 2.178 | 4.291 |
Budgets
Boqueixón – Council budget trend
| Boqueixón budgets 1985–2016 | |||||
| Year | Total revenue | % | Total expenditure | % | |
| 2016 | 3.128.195,78 € | 12.77% | 3.128.195,78 € | 12.77% | |
| 2015 | 2.773.846,04 € | -9.01% | 2.773.846,04 € | -9.01% | |
| 2014 | 3.048.625,67 € | 8.17% | 3.048.625,67 € | 5.03% | |
| 2013 | 2.818.246,89 € | 2.39% | 2.902.485,82 € | 5.88% | |
| 2012 | 2.752.437,73 € | -22.37% | 2.741.226,92 € | -22.63% | |
| 2011 | 3.545.704,21 € | -16.44% | 3.543.071,24 € | -12.99% | |
| 2010 | 4.243.483,07 € | -15.77% | 4.072.053,92 € | -19.13% | |
| 2009 | 5.038.163,84 € | 12.72% | 5.035.557,91 € | 12.05% | |
| 2008 | 4.469.549,41 € | 22.80% | 4.493.854,70 € | 21.09% | |
| 2007 | 3.639.796,60 € | 2.25% | 3.711.035,10 € | 4.25% | |
| 2006 | 3.559.720,43 € | 40.65% | 3.559.720,43 € | 40.65% | |
| 2005 | 2.530.940,94 € | 5.97% | 2.530.940,94 € | 5.97% | |
| 2004 | 2.388.445,97 € | 34.40% | 2.388.445,97 € | 35.56% | |
| 2003 | 1.777.057,03 € | 7.21% | 1.761.852,77 € | 7.87% | |
| 2002 | 1.657.598,69 € | -12.70% | 1.633.334,34 € | -13.98% | |
| 2001 | 1.898.735,72 € | 2.87% | 1.898.735,73 € | 2.87% | |
| 2000 | 1.845.836,77 € | 29.78% | 1.845.836,76 € | 29.78% | |
| 1998 | 1.422.301,75 € | 14.21% | 1.422.301,74 € | 14.21% | |
| 1997 | 1.245.370,83 € | 59.77% | 1.245.370,85 € | 59.77% | |
| 1996 | 779.462,21 € | 7.44% | 779.462,21 € | 7.44% | |
| 1995 | 725.486,28 € | -2.96% | 725.486,29 € | -2.96% | |
| 1994 | 747.610,04 € | -11.73% | 747.610,05 € | -11.73% | |
| 1993 | 846.986,08 € | 35.04% | 846.986,07 € | 35.04% | |
| 1992 | 627.207,67 € | 83.40% | 627.207,66 € | 83.40% | |
| 1991 | 341.986,54 € | 1.04% | 341.986,54 € | 1.04% | |
| 1990 | 338.479,91 € | 14.37% | 338.479,91 € | 14.37% | |
| 1989 | 295.961,80 € | 8.79% | 295.961,79 € | 8.79% | |
| 1988 | 272.042,73 € | 26.89% | 272.042,71 € | 26.89% | |
| 1987 | 214.386,96 € | 13.20% | 214.386,97 € | 13.20% | |
| 1986 | 189.390,93 € | 0.24% | 189.390,94 € | 0.24% | |
| 1985 | 188.946,20 € | 188.946,19 € | |||
Vehicle tax
Boqueixón – Motor vehicle tax
Key:
CF: fiscal horsepower (cabalos fiscais).
CU: payload (carga útil).
| Cars | ||||||||||
| Year | Up to 8 CF | % | Up to 11.99 CF | % | Up to 15.99 CF | % | Up to 19.99 CF | % | 20 CF and over | % |
| 2016 | 18.93 | 0.00% | 51.12 | 0.00% | 107.91 | 0.00% | 134.42 | 0.00% | 168 | 0.00% |
| 2015 | 18.93 | 0.00% | 51.12 | 0.00% | 107.91 | 0.00% | 134.42 | 0.00% | 168 | 0.00% |
| 2014 | 18.93 | 0.00% | 51.12 | 0.00% | 107.91 | 0.00% | 134.42 | 0.00% | 168 | 0.00% |
| 2013 | 18.93 | 0.00% | 51.12 | 0.00% | 107.91 | 0.00% | 134.42 | 0.00% | 168 | 0.00% |
| 2012 | 18.93 | 36.38% | 51.12 | 36.36% | 107.91 | 36.35% | 134.42 | 36.37% | 168 | 36.36% |
| 2011 | 13.88 | 0.00% | 37.49 | 0.00% | 79.14 | 0.00% | 98.57 | 0.00% | 123.2 | 0.00% |
| 2010 | 13.88 | 0.00% | 37.49 | 0.00% | 79.14 | 0.00% | 98.57 | 0.00% | 123.2 | 0.00% |
| 2009 | 13.88 | 0.00% | 37.49 | 0.00% | 79.14 | 0.00% | 98.57 | 0.00% | 123.2 | 0.00% |
| 2008 | 13.88 | 0.00% | 37.49 | 0.00% | 79.14 | 0.00% | 98.57 | 0.00% | 123.2 | 0.00% |
| 2007 | 13.88 | 0.00% | 37.49 | 0.00% | 79.14 | 0.00% | 98.57 | 0.00% | 123.2 | 0.00% |
| 2006 | 13.88 | 0.00% | 37.49 | 0.00% | 79.14 | 0.00% | 98.57 | 0.00% | 123.2 | 0.00% |
| 2005 | 13.88 | 9.98% | 37.49 | 10.01% | 79.14 | 10.01% | 98.57 | 10.00% | 123.2 | 10.00% |
| 2004 | 12.62 | 0.00% | 34.08 | 0.00% | 71.94 | 0.00% | 89.61 | 0.00% | 112 | 0.00% |
| 2003 | 12.62 | 0.00% | 34.08 | 0.00% | 71.94 | 0.00% | 89.61 | 0.00% | 112 | 0.00% |
| 2002 | 12.62 | 0.00% | 34.08 | 0.00% | 71.94 | 0.00% | 89.61 | 0.00% | 112 | 0.00% |
| 2001 | 12.62 | 0.00% | 34.08 | 0.00% | 71.94 | 0.00% | 89.61 | 0.00% | 112 | 0.00% |
| 2000 | 12.62 | 0.00% | 34.08 | 0.00% | 71.94 | 0.00% | 89.61 | 0.00% | 112 | 0.00% |
| Buses | ||||||||
| Year | Under 21 seats | % | 21–50 seats | % | Over 50 seats | % | ||
| 2016 | 124.95 | 0.00% | 177.96 | 0.00% | 222.45 | 0.00% | ||
| 2015 | 124.95 | 0.00% | 177.96 | 0.00% | 222.45 | 0.00% | ||
| 2014 | 124.95 | 0.00% | 177.96 | 0.00% | 222.45 | 0.00% | ||
| 2013 | 124.95 | 0.00% | 177.96 | 0.00% | 222.45 | 0.00% | ||
| 2012 | 124.95 | 36.36% | 177.96 | 36.37% | 222.45 | 36.36% | ||
| 2011 | 91.63 | 0.00% | 130.5 | 0.00% | 163.13 | 0.00% | ||
| 2010 | 91.63 | 0.00% | 130.5 | 0.00% | 163.13 | 0.00% | ||
| 2009 | 91.63 | 0.00% | 130.5 | 0.00% | 163.13 | 0.00% | ||
| 2008 | 91.63 | 0.00% | 130.5 | 0.00% | 163.13 | 0.00% | ||
| 2007 | 91.63 | 0.00% | 130.5 | 0.00% | 163.13 | 0.00% | ||
| 2006 | 91.63 | 0.00% | 130.5 | 0.00% | 163.13 | 0.00% | ||
| 2005 | 91.63 | 10.00% | 130.5 | 10.00% | 163.13 | 10.00% | ||
| 2004 | 83.3 | 0.00% | 118.64 | 0.00% | 148.3 | 0.00% | ||
| 2003 | 83.3 | 0.00% | 118.64 | 0.00% | 148.3 | 0.00% | ||
| 2002 | 83.3 | 0.00% | 118.64 | 0.00% | 148.3 | 0.00% | ||
| 2001 | 83.3 | 0.00% | 118.64 | 0.00% | 148.3 | 0.00% | ||
| 2000 | 83.3 | 0.00% | 118.64 | 0.00% | 148.3 | 0.00% | ||
| Lorries | ||||||||||
| Year | Under 1,000 kg CU | % | 1,000–2,999 kg CU | % | 2,999–9,999 kg CU | % | Over 9,999 kg CU | % | ||
| 2016 | 63.42 | 0.00% | 124.95 | 0.00% | 177.96 | 0.00% | 222.45 | 0.00% | ||
| 2015 | 63.42 | 0.00% | 124.95 | 0.00% | 177.96 | 0.00% | 222.45 | 0.00% | ||
| 2014 | 63.42 | 0.00% | 124.95 | 0.00% | 177.96 | 0.00% | 222.45 | 0.00% | ||
| 2013 | 63.42 | 0.00% | 124.95 | 0.00% | 177.96 | 0.00% | 222.45 | 0.00% | ||
| 2012 | 63.42 | 36.36% | 124.95 | 36.36% | 177.96 | 36.37% | 222.45 | 36.36% | ||
| 2011 | 46.51 | 0.00% | 91.63 | 0.00% | 130.5 | 0.00% | 163.13 | 0.00% | ||
| 2010 | 46.51 | 0.00% | 91.63 | 0.00% | 130.5 | 0.00% | 163.13 | 0.00% | ||
| 2009 | 46.51 | 0.00% | 91.63 | 0.00% | 130.5 | 0.00% | 163.13 | 0.00% | ||
| 2008 | 46.51 | 0.00% | 91.63 | 0.00% | 130.5 | 0.00% | 163.13 | 0.00% | ||
| 2007 | 46.51 | 0.00% | 91.63 | 0.00% | 130.5 | 0.00% | 163.13 | 0.00% | ||
| 2006 | 46.51 | 0.00% | 91.63 | 0.00% | 130.5 | 0.00% | 163.13 | 0.00% | ||
| 2005 | 46.51 | 10.00% | 91.63 | 10.00% | 130.5 | 10.00% | 163.13 | 10.00% | ||
| 2004 | 42.28 | 0.00% | 83.3 | 0.00% | 118.64 | 0.00% | 148.3 | 0.00% | ||
| 2003 | 42.28 | 0.00% | 83.3 | 0.00% | 118.64 | 0.00% | 148.3 | 0.00% | ||
| 2002 | 42.28 | 0.00% | 83.3 | 0.00% | 118.64 | 0.00% | 148.3 | 0.00% | ||
| 2001 | 42.28 | 0.00% | 83.3 | 0.00% | 118.64 | 0.00% | 148.3 | 0.00% | ||
| 2000 | 42.28 | 0.00% | 83.3 | 0.00% | 118.64 | 0.00% | 148.3 | 0.00% | ||
| Tractors | ||||||
| Year | Under 16 CF | % | 16–25 CF | % | Over 25 CF | % |
| 2016 | 26.51 | 0.00% | 41.66 | 0.00% | 124.95 | 0.00% |
| 2015 | 26.51 | 0.00% | 41.66 | 0.00% | 124.95 | 0.00% |
| 2014 | 26.51 | 0.00% | 41.66 | 0.00% | 124.95 | 0.00% |
| 2013 | 26.51 | 0.00% | 41.66 | 0.00% | 124.95 | 0.00% |
| 2012 | 26.51 | 36.37% | 41.66 | 36.41% | 124.95 | 36.36% |
| 2011 | 19.44 | 0.00% | 30.54 | 0.00% | 91.63 | 0.00% |
| 2010 | 19.44 | 0.00% | 30.54 | 0.00% | 91.63 | 0.00% |
| 2009 | 19.44 | 0.00% | 30.54 | 0.00% | 91.63 | 0.00% |
| 2008 | 19.44 | 0.00% | 30.54 | 0.00% | 91.63 | 0.00% |
| 2007 | 19.44 | 0.00% | 30.54 | 0.00% | 91.63 | 0.00% |
| 2006 | 19.44 | 0.00% | 30.54 | 0.00% | 91.63 | 0.00% |
| 2005 | 19.44 | 10.02% | 30.54 | 9.97% | 91.63 | 10.00% |
| 2004 | 17.67 | 0.00% | 27.77 | 0.00% | 83.3 | 0.00% |
| 2003 | 17.67 | 0.00% | 27.77 | 0.00% | 83.3 | 0.00% |
| 2002 | 17.67 | 0.00% | 27.77 | 0.00% | 83.3 | 0.00% |
| 2001 | 17.67 | 0.00% | 27.77 | 0.00% | 83.3 | 0.00% |
| 2000 | 17.67 | 0.00% | 27.77 | 0.00% | 83.3 | 0.00% |
| Trailers | ||||||
| Year | 750–1,000 kg CU | % | 1,000–2,999 kg CU | % | Over 2,999 kg CU | % |
| 2016 | 26.51 | 0.00% | 41.66 | 0.00% | 124.95 | 0.00% |
| 2015 | 26.51 | 0.00% | 41.66 | 0.00% | 124.95 | 0.00% |
| 2014 | 26.51 | 0.00% | 41.66 | 0.00% | 124.95 | 0.00% |
| 2013 | 26.51 | 0.00% | 41.66 | 0.00% | 124.95 | 0.00% |
| 2012 | 26.51 | 36.37% | 41.66 | 36.41% | 124.95 | 36.36% |
| 2011 | 19.44 | 0.00% | 30.54 | 0.00% | 91.63 | 0.00% |
| 2010 | 19.44 | 0.00% | 30.54 | 0.00% | 91.63 | 0.00% |
| 2009 | 19.44 | 0.00% | 30.54 | 0.00% | 91.63 | 0.00% |
| 2008 | 19.44 | 0.00% | 30.54 | 0.00% | 91.63 | 0.00% |
| 2007 | 19.44 | 0.00% | 30.54 | 0.00% | 91.63 | 0.00% |
| 2006 | 19.44 | 0.00% | 30.54 | 0.00% | 91.63 | 0.00% |
| 2005 | 19.44 | 10.02% | 30.54 | 9.97% | 91.63 | 10.00% |
| 2004 | 17.67 | 0.00% | 27.77 | 0.00% | 83.3 | 0.00% |
| 2003 | 17.67 | 0.00% | 27.77 | 0.00% | 83.3 | 0.00% |
| 2002 | 17.67 | 0.00% | 27.77 | 0.00% | 83.3 | 0.00% |
| 2001 | 17.67 | 0.00% | 27.77 | 0.00% | 83.3 | 0.00% |
| 2000 | 17.67 | 0.00% | 27.77 | 0.00% | 83.3 | 0.00% |
| Mopeds | ||
| Year | Mopeds | % |
| 2016 | 6.63 | 0.00% |
| 2015 | 6.63 | 0.00% |
| 2014 | 6.63 | 0.00% |
| 2013 | 6.63 | 0.00% |
| 2012 | 6.63 | 36.42% |
| 2011 | 4.86 | 0.00% |
| 2010 | 4.86 | 0.00% |
| 2009 | 4.86 | 0.00% |
| 2008 | 4.86 | 0.00% |
| 2007 | 4.86 | 0.00% |
| 2006 | 4.86 | 0.00% |
| 2005 | 4.86 | 9.95% |
| 2004 | 4.42 | 0.00% |
| 2003 | 4.42 | 0.00% |
| 2002 | 4.42 | 0.00% |
| 2001 | 4.42 | 0.00% |
| 2000 | 4.42 | 0.00% |
| Motorcycles | ||||||||||
| Year | Up to 125 cc | % | 125–250 cc | % | 250–500 cc | % | 500–1,000 cc | % | Over 1,000 cc | % |
| 2016 | 6.63 | 0.00% | 11.36 | 0.00% | 22.73 | 0.00% | 45.44 | 0.00% | 90.87 | 0.00% |
| 2015 | 6.63 | 0.00% | 11.36 | 0.00% | 22.73 | 0.00% | 45.44 | 0.00% | 90.87 | 0.00% |
| 2014 | 6.63 | 0.00% | 11.36 | 0.00% | 22.73 | 0.00% | 45.44 | 0.00% | 90.87 | 0.00% |
| 2013 | 6.63 | 0.00% | 11.36 | 0.00% | 22.73 | 0.00% | 45.44 | 0.00% | 90.87 | 0.00% |
| 2012 | 6.63 | 36.42% | 11.36 | 36.37% | 22.73 | 36.43% | 45.44 | 36.37% | 90.87 | 36.36% |
| 2011 | 4.86 | 0.00% | 8.33 | 0.00% | 16.66 | 0.00% | 33.32 | 0.00% | 66.64 | 0.00% |
| 2010 | 4.86 | 0.00% | 8.33 | 0.00% | 16.66 | 0.00% | 33.32 | 0.00% | 66.64 | 0.00% |
| 2009 | 4.86 | 0.00% | 8.33 | 0.00% | 16.66 | 0.00% | 33.32 | 0.00% | 66.64 | 0.00% |
| 2008 | 4.86 | 0.00% | 8.33 | 0.00% | 16.66 | 0.00% | 33.32 | 0.00% | 66.64 | 0.00% |
| 2007 | 4.86 | 0.00% | 8.33 | 0.00% | 16.66 | 0.00% | 33.32 | 0.00% | 66.64 | 0.00% |
| 2006 | 4.86 | 0.00% | 8.33 | 0.00% | 16.66 | 0.00% | 33.32 | 0.00% | 66.64 | 0.00% |
| 2005 | 4.86 | 9.95% | 8.33 | 10.04% | 16.66 | 9.97% | 33.32 | 10.00% | 66.64 | 10.00% |
| 2004 | 4.42 | 0.00% | 7.57 | 0.00% | 15.15 | 0.00% | 30.29 | 0.00% | 60.58 | 0.00% |
| 2003 | 4.42 | 0.00% | 7.57 | 0.00% | 15.15 | 0.00% | 30.29 | 0.00% | 60.58 | 0.00% |
| 2002 | 4.42 | 0.00% | 7.57 | 0.00% | 15.15 | 0.00% | 30.29 | 0.00% | 60.58 | 0.00% |
| 2001 | 4.42 | 0.00% | 7.57 | 0.00% | 15.15 | 0.00% | 30.29 | 0.00% | 60.58 | 0.00% |
| 2000 | 4.42 | 0.00% | 7.57 | 0.00% | 15.15 | 0.00% | 30.29 | 0.00% | 60.58 | 0. |
Property tax
Boqueixón – Property tax (IBI)
| Annual change in property tax (IBI) in Boqueixón | |||||||
| Year | Cadastral rev. | Urban rate | % | Rural rate | % | Special char. | % |
| 2016 | 2002 | 0.44 | 0.00% | 0.44 | 0.00% | 1.3 | 0.00% |
| 2015 | 2002 | 0.44 | -12.00% | 0.44 | 0.00% | 1.3 | 0.00% |
| 2014 | 1996 | 0.5 | 0.00% | 0.44 | 0.00% | 1.3 | 0.00% |
| 2013 | 1996 | 0.5 | 13.64% | 0.44 | 0.00% | 1.3 | 0.00% |
| 2012 | 1996 | 0.44 | 0.00% | 0.44 | 33.33% | 1.3 | 0.00% |
| 2011 | 1996 | 0.44 | 0.00% | 0.33 | 0.00% | 1.3 | 0.00% |
| 2010 | 1996 | 0.44 | 0.00% | 0.33 | 0.00% | 1.3 | 0.00% |
| 2009 | 1996 | 0.44 | 0.00% | 0.33 | 0.00% | 1.3 | 0.00% |
| 2008 | 1996 | 0.44 | 0.00% | 0.33 | 0.00% | 1.3 | 0.00% |
| 2007 | 1996 | 0.44 | 0.00% | 0.33 | 0.00% | 1.3 | 0.00% |
| 2006 | 2002 | 0.44 | 0.00% | 0.33 | 0.00% | 1.3 | 0.00% |
| 2005 | 1996 | 0.44 | 10.00% | 0.33 | -49.23% | 1.3 | 0.00% |
| 2004 | 1996 | 0.4 | 0.00% | 0.65 | 0.00% | 1.3 | 0.00% |
| 2003 | 1996 | 0.4 | 0.00% | 0.65 | 0.00% | 0 | 0.00% |
| 2002 | 1996 | 0.4 | 0.00% | 0.65 | 0.00% | 0 | 0.00% |
| 2001 | 1996 | 0.4 | 0.00% | 0.65 | 0.00% | 0 | 0.00% |
| 2000 | 1996 | 0.4 | 0.00% | 0.65 | 0.00% | 0 | 0.00% |